Introduction - The Climaps Project
Climaps
is a meteorological data storing, processing and visualization system by Sensorscope.
Sensorscope is a start-up company from the EPFL, a spin-off of a project with the same name.

Climaps is a complete weather monitoring solution.
- It stores, processes and shows thousands of data registers every day, some hundred millions every year.
- It is an scalable and modular system which allows company growth.
- Responds to a very precise hardware requirements and data register format.
- Uses free software solutions due to start-up budget restrictions.
- Connects users with the environment conditions as an integrated whole system.
- Proposes a new concept of meteorological websites, modern and easy to use.
- Integrates several systems and technologies to provide users with a complete tool.
Introduction - Technologies used
Climaps has been completely designed and coded over free software solutions, for the sake of
reliability, stability, portability, documentation, and last but not least, budget restrictions.
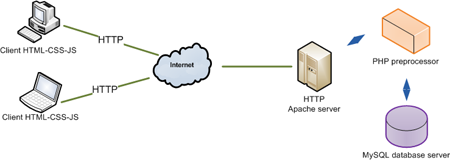
Climaps uses a
LAMP environment.
- A LAMP environment is used.
- The servers run on Ubuntu / Fedora.
- MySQL provides the database engine.
- Apache - PHP serve the HTMl interfaces.
- JavaScript - jQuery (and Dojo, prototype, scriptaculous) animate the HTML-CSS interfaces.
Introduction - System architecture
The whole system has been designed and build based on a layers architecture, as shown in the pyramide
diagram. A special effort has been done to rely the most logic, code and processing force on
the bottom layers. This way, the higher level programming and design is faster and more powerful
with less code lines.
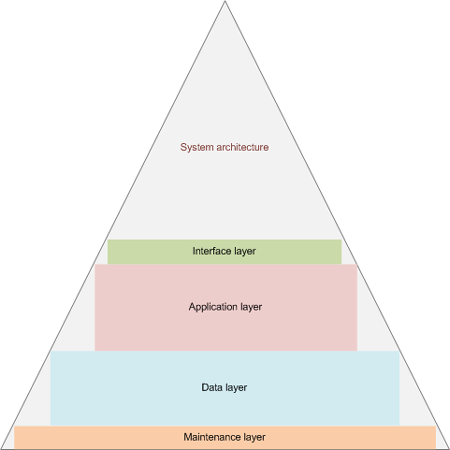
Climaps architecture.
-
The maintenance layer containes server scripts which look for the database best performance.
- Creation of data cubes - averages - periodically.
- Tables index optimization.
- Deletion of logs and temporary files.
-
The data layer is implemented through MySQL and contains all the system's data structure and information.
- All that can be implemented in SQL has been contained in the data model - including part of the maintenance layer logic.
- Several databases arrange information for different purposes.
- InnoDB allows a relational model suitable for an environment of many write and read concurrent transactions.
-
The application layer is built on Code Igniter, a light MVC framework written on PHP which implements all the functionalities.
- Some methods create interfaces, other act as backends for the AJAX actions.
- Some modules use Code Igniter as a POST / XML server for related functions.
-
The interface layer is based on HTML and CSS, and is enhanced with jQuery which provides with effects and AJAX actions.
- Allows a smoother user interaction with the application, and a better user experience.
- Designed to be easy to use, ergonomic and look-appealing.
- Compatible with the latest versions of the major browsers.
Maintenance layer
The maintenance layer includes several scripts and database functions that are executed periodically
thanks to the cron daemon.

Several maintenance scripts keep the database running smoothly.
- Several programming languages according to its suitability: PHP, Python, Bash, SQL.
-
Some examples:
- Every 15 minutes, 1 hour and 1 day the correspondent MySQL stored function is executed to create data cubes.
- Every night a script cleans the tables indexes.
- Every night a script monitorizes the tables sizes and the server free space and writes a log.
- Every night a couple of optimization scripts run and send tips to improve performance to my email.
- Every nigh a website and database bakup are performed and the copies are stored in a remote server.
- Every hour a script deletes all temporary files generated by information transactions between different system modules.
- Every month a script cleans some cache tables which store the result of external webservices like sunset and sunrise times.
-
In the case of data cubes, the logic of the script has been kept into a set of MySQL stored functions.
- As far as it is possible, all data pre-processing and all data structures definition should be kept in the data model.
- Data cubes rely firmly on weather data structure, thus it is a good practice to abstract this from the outside.
Data layer - MySQL model
The data layer is implemented on MySQL on a Ubuntu server, and has needed some extra engineering
in order to manage a high geographical and temporal data set.

Data model partition schema.
- Challenge faced up: storing and serving millions of data registers every month.
- MySQL query performance starts degrading after a few million entries on the same table, despite indexes.
-
Divide et Impera: meteorological data is kept in several tables:
- MySQL 5.2 sharding would have worked, but the data physical location is obscured.
- We wanted data of every station to be in a known table / file for easier and faster maintenance operations.
- All data tables have the same structure which is contained in a Stored Function.
- A series of Trigges keep data linked.
- After two years, old data will be moved to depots, rarely used.
- Result: 300 million registers up to 2010 are stored and served in real-time.
Data layer - Advanced Features
Other MySQL resources have been used to provide the better database performance possible: triggers, stored functions and stored views.
-
Triggers have been implemented for multiple purposes, from data loss prevention to automatic linking and resumes.
- Stored data is very valuable, and it must be kept safe from accidental deletions. A trigger on each data table produces a controlled error on data deletion.
-
Some redundant tables are updated with resumed information for faster queries. For that, an insert query is launched in some cases after data has been received.
- InstalledSensors table keeps the last value for a combination of station, sensor and timestamp. It helps to show current data on real-time with almost no effort.
- SensorFamilies table is updated with new entries if an unrecognised sensor sends data to the system. This avoids relational errors on insert as the data is categorized with the minimum information needed to recover it.
- Other tables follow the same principle.
-
Stored Functions are used for some maintenance tasks, and for some particular queries as well.
- A function creates a new station's table and resources provided an ID. It helps to keep data structure in the SQL definition.
- Some queries cannot be used for Stored Views, and are useful to be kept in the data model so that the application is independent from it. These are implemented with Stored Functions which produce a result to the MySQL client output.
- A set of functions create the data cubes when they are called from cron jobs.
-
Stored Views are queries used to define virtual tables, so that the latter ones can be read easily from the application. It avoids populating the application layer with long queries, by creating views with the most used fields related to a table.
- Stations are extended to show owner's information and some flags like last received data time.
- Users are extended to show some custom configurations and their group's details.
- This technique is used thouroughly in Climaps.
Data layer - Security
Security and data privacy is a subject itself. It has been implemented in Climaps through its different layers. It starts with MySQL, whose clients are restricted to the only resources they need to operate.
- The website reads all data, but writes only on administration and site-related tables.
-
Another special user allows stations creation and deletion.
- Protective triggers must be turned down.
- Concerned table has to be created / deleted.
- Stations table must be updated.
- Protective triggers must be turned on again.
- Data cubes functions can only read meteorological data and write into cubes' tables.
- Maintenance scripts can read and write only to the tables related to their operations.
-
Other users for:
- Data receivers.
- Alarms daemon.
- Cameras receiver.
- Etc.
Application layer - Code Igniter and MVC
Code Igniter is a lightweight MVC framework written in PHP which helps daily
web development tasks by implementing most common issues like security,
privacy, data access, and HTML generation.
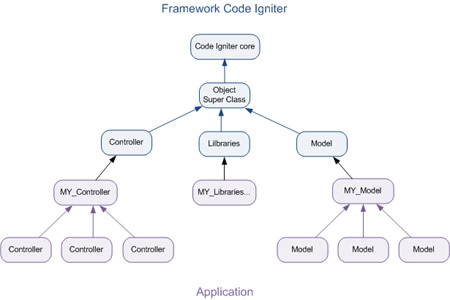
Hierarchy used in Climaps application architecture.
-
All controllers inherit from MY_Controller, a parent class which manages the common
work flow.
- Loads user data from session.
- Checks user access rights.
- Loads i18n system to allow localizations.
- Depending on server / application mode, it loads other subsystems.
-
All models inherit from MY_Model, a parent class that reuses code by implementing the
major used queries on just one file.
-
Every model has a few attributes which indicate the table to operate with,
the ID field name, and so forth.
- GetAll() is the most complete function, on which 80% of queries rely.
It accepts a dozen parameters so it can be used thourough all the application.
- Common administration data tasks like CRUD methods are implemented here.
- Data validation too.
-
The views system is managed by the library Layout, which loads a common container view and
renders the output of every method (the content) within.
- HTML - PHP views can be reused.
- There is no need to use include().
Application layer - Subsystems
The overall application flow is managed by MY_Controller parent class, but it relies also
on several libraries which control a specific part of the system.
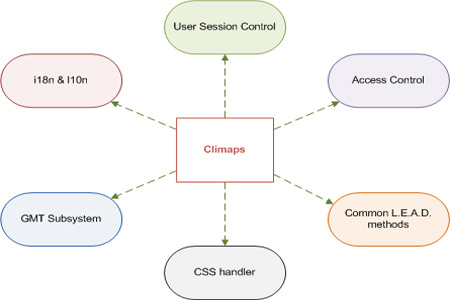
Several subsystems help to use lighter controllers.
- Session stores and retrieves users data; it abstracts the data storing
into the database and the session management (creation, deletion, login, logout, changes) from
the rest of the application.
- Auth checks that the current logged in user has access to the
requested method. To do so, the method name is checked against an associative array
of pairs 'method'=>array_of_user_levels. Every controller must have this array in order to
make its methods public.
- Localization manages the i18n initialization through gettext(), and
provides with helper functions to easily translate messages.
- GMT manages stations GMT offset which is preloaded when working on
application mode and disabled on server mode. It merges several settings (User, Contact,
Station, geographical position, and browser) to decide what GMT offset should be applied.
- CSS handler allows to register all CSS files included from the application in an internal array.
Then, when outputing the result all CSS files are included into the HTML code at once.
Application layer - Interface and server modes
Code Igniter is used as a backend application which can render HTML views, XML or JSON messages, or act as a server to receive data.
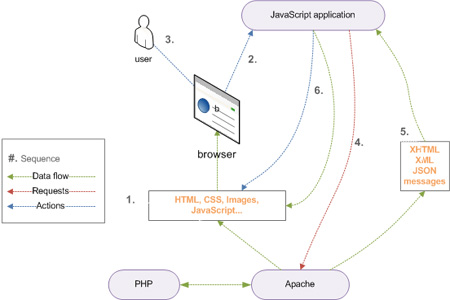
Climaps has a
PHP back-end which outputs text in different formats.
-
Interface mode is the normal operation mode. It writes an output than can be interpreted by the browser.
- The initial view is rendered in HTML.
-
AJAX requests get information in several formats:
- HTML for some PHP rendering advantages.
- XML for JavaScript parsing and DOM modifications.
- JSON for meteorological data to be plotted.
- Plain text as a simple response for unitary requests.
-
Server mode is an advanced mode which turns off some subsistems and is used to:
- Receive cameras' pictures through a POST listener.
- Create XML datasets for external applications.
- In any case, messages are returned to the browser as interface mode would.
Interface layer - jQuery and AJAX
The interfaces have been designed for ergonomy, usability and a best interaction experience.
They are mostly built in HTML + CSS + JavaScript. To write JavaScript, jQuery has been adopted
as a framework, due to its capabilities, performance and ease to write code.
Climaps back-end writes the format that the
AJAX request is expecting.
- jQuery is multi-platform.
-
It is used to collect user interaction and launch requests:
-
AJAX an asynchronous petition is launched against the PHP backend.
Thanks to the browser architecture, the session is kept so that data received matches
the logged in user. When the data is back, the DOM is updated accordingly.
-
Interface changes. Some interfaces have several steps of advanced and simple mode.
With jQuery it is easy to hide and show the elements that are needed on each stage.
-
Third party applications. EJSChart is used to plot data, and it uses as a source
a text file that must be specified through JavaScript. In the same line, Flot is used for other
statistic graphs and its data is also changed dynamically thanks to JavaScript and jQuery.
-
Size effects. The interfaces try to use all the available space in the browser's window.
Some parts are resized according to the window size for a better usability.
-
AJAX sandbox problem:
- AJAX queries can only be performed to urls within the same domain where the web application executes.
- External XML sources are loaded by asking a PHP proxy method to load them and pass the content to the main output.
- These proxy methods can only be executed by logged in users and the content read is not interpreted nor executed, but just output to the browser; thus, it is secure.
Interface layer - connecting to PHP application
JavaScript is a client-side scripting language while PHP is a server-side technology.
Data persistence is always a trouble that has been fixed on PHP by using sessions
stored into a database. However, the normal HTTP request just renders a static HTML view.
JavaScript will start from that and change the application status, the view itself and,
in some cases, even the user session.
PHP initializes
JS variables, and
JS updates them through
AJAX calls.
- Variables are passed from PHP to JavaScript through direct JS code generation. Just like
PHP renders HTML, it can also render a script tag with custom JS variables and values.
- From that point, the JS application is detached from the PHP persistent background. Any
changes made will be lost unless they are sent to the server.
- POST requests use PHP methods to process data in forms and store it into a database.
- User configurations and system status variables are sent through AJAX to a PHP listener.
This will update user session accordingly, keeping a consistent duplicate of the information
currently stored within JS internal variables.
- Some periodical jobs will check on the PHP platform the status about a specific service
which might be affected by external scripts (for instance, alarms). The results are sent back
to JS so that system events can be handled just like user events are.
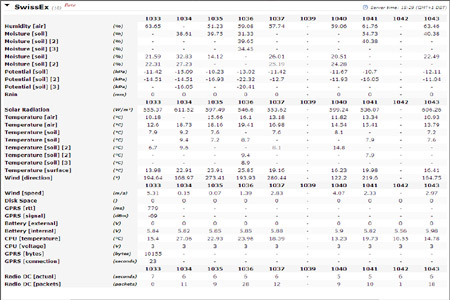
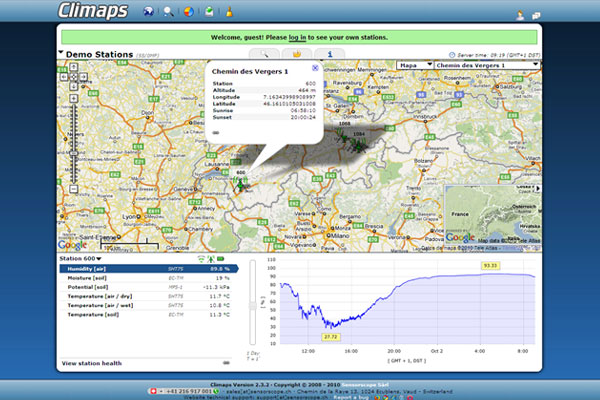
Features - Map view
The map view is the most used interface in Climaps. It integrates a Google Maps API and uses JavaScript and AJAX (jQuery) to load data periodically.
The entire interface has been designed for the best user experience and ergonomy, and has been programmed
to use all the available space on the browser window.
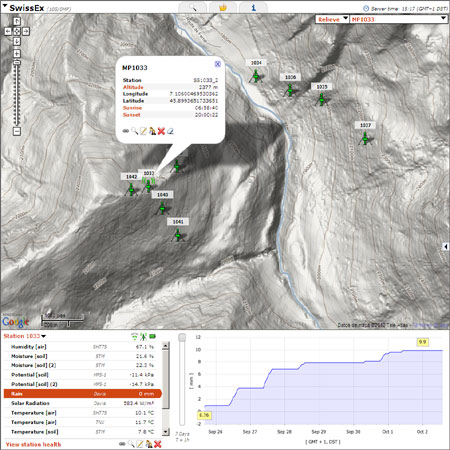
Climaps map view integrates
Google Maps and custom applications.
- An event detects windows resize actions to change map's size.
-
Every three minutes, an XML file is requested from the backend with updated information about every station:
- Stations status (active, inactive).
- Measure points (geographical classification for stations).
- Last values for each sensor on the selected station.
- A graph for the recent data.
-
Data is loaded progressively:
- Initially, a list of stations and measure points is populated.
- When selecting a station, an AJAX requests gets its sensors information.
- When choosing a sensor, another AJAX query gets the recent graph.
Features - Plotter
The plotter interface implements a third party application called EJSChart. It works with a provided JS API which loads XML data sets into graphs.
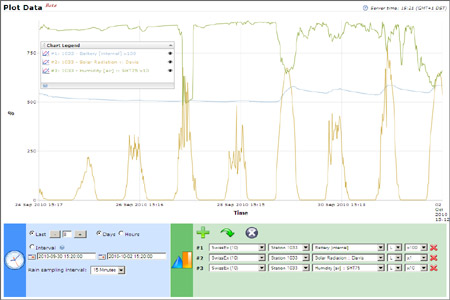
Plotter interface implements EJSChart and allows advanced graphs.
- Like map view, this screen has been optimised to use all the available space and to be usable and ergonomic.
- All the interface status is controlled with a JavaScript application.
- Data is loaded on demand, and generated on the fly thanks to AJAX queries.
-
Cubes systems are used here:
- Guests can only plot 1h resolution data, so that they don't overload the server.
- Registered users can plot high-resolution (up to 1 min) data for short time intervals.
- For medium and long time intervals, 15 min and 1 hour resolution cubes are used instead.
- Cubes are generated on database side by grouping sensors and stations by time intervals and calculating averages, maximums and minimums, and number of values as well (so that cumulated values can be reconstructed).
Features - Downloader
Downloader interface shares some principles used on the design of the plotter interface, but it has to deal with far more options.
The goal of this interface is to provide a versatile tool to download data in the exact formate required by each client, so that it
is suitable for their processing scripts. Thus, data files have to be generated on the fly instead of being pregenerated with default options.
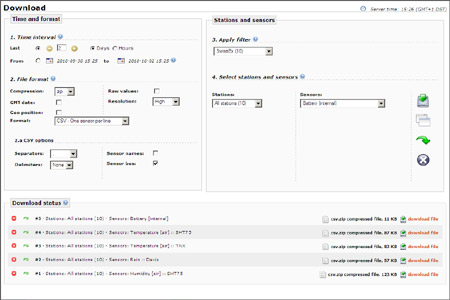
The downloader interface allows on the fly file generation.
- A system of classes manage all possible formats allowing to reuse code on a smart way.
- The overall aplication status is kept in JavaScript variables.
- Files are compressed before being served.
- TO-DO: implement a FIFO queue so that files are served sequentially without overloading the server.
-
Some available options:
- Time interval.
- Type of compression.
- Show GMT data or only UNIX Epoch time.
- Format: all values in a column, or each sensor in a single column (matrix-like).
- CSV separators and delimiters.
Features - other interfaces
Climaps is continuously growing and new interfaces are being created and enhanced.
The overview interface provides a quicker way to monitor stations status.
-
The overview interface serves as a different apporach to monitor stations last data and status. Instead of representing stations geographically, they are listed on a table,
showing on a quick glance whether any error has appeared on any station.
- It uses AJAX to asynchronously load an updated data table every three minutes.
- Useful for technical staff who is in charge of stations monitoring.
-
The link qualities interface shows the last network quality values between all the stations concerned.
- It follows the same principles than the overview interface.
- Some additional controls: filter by station and neighbour, and select time interval.
- A back-end version allows external scripts to load an XML data file.
- The same methods are overloaded to allow CSV data downloading from a query being shown on the interface.
Features - Alarms: web application
The alarms system is particularly important and interesting as it is implemented in all application layers, from server to interface.

Software alarms can be set up easily with Climaps.
-
Interfaces
- They allow to create new alarms by choosing a number of combinations of stations, sensors and the trigger values.
- An hysteresis value for recuperation can be set.
- It integrates a small graph application so that alarms are visually understood.
- Some extra options: repetition interval, repetition limit, custom emails and phones to notify.
-
PHP application
- It serves as a connector between interfaces and data model.
- Basic security and privacy is implemented.
-
Data model
-
It consists on several tables, each one with a purpose
- EventDetectors stocks the alarm definitions.
- EventConditions allow several conditions per alarm.
- EventAlarms registers the alerts triggered.
- EventNotificationChannels is a configuration table to allow several ways to notify user (web, email, sms, voice).
- EventMessagesSent keeps a record of messages sent for further analyse.
Features - Alarms: server scripts
The core functionality of the alarms system is done by a couple of server scripts in Python, which analyse last stations data and compares it with
users alarm conditions to determine whether an alarm should be triggered. The second scripts reads all triggered alerts' information to determine whether
and how and who should be notified about the event.
- They run every minute.
- The first script writes into the database the alarms that triggers.
-
The second one gets the message and checks the channels and addresses and numbers to send notifications:
- Web will show a popup message while browsing the website.
- Email will send emails through an SMTP server to the selected addresses.
- SMS will send an SMS through an external service to the provided numbers.
- Voici will send a synthetised text2speech message through an external service to the registered phones.
- Triggered alarms whose conditions do not longer match will be shut down, and database updated accordingly.
- TO-DO: implement a priority algorithm to avoid overlapping if many alarms are registered.
Features - Cameras: adapting the hardware
Cameras are a particular type of hardware attached to stations. They can be recognized by the latters and registered
in Climaps as sensors, but they only work autonomously. Thus, the pictures sent must be received, treated and stored on a different way.
- When attached to a station, the latter one will send a fake data package every 15 minutes so that the system
knows about the existence of this hardware. The value of the package is not a physical magnitude but the internal number of the camera.
This way, the systems knows which camera was installed on what station along time.
- The camera ID has to be registered internally with a station ID, so that the system can apply privacy.
- Cameras can only connect to FTP servers with a simple user / password combination. Initially, there is no way to ensure privacy for pictures from different cameras from different users.
- To solve this problem, and others related to related to connectivity that might arise,
a persistent home-made FTP server has been developed in Python.
- It only receives data from cameras.
- It passes the camera ID as a parameter for further processing.
- It implements a buffer to avoid connection errors with the Climaps system.
- Finally, the FTP server re-sends data to a POST back-end in Code Igniter Climaps web application.
- It checks for correct camera - station assignation.
- It creates thumbnails and stamps the date on a corner.
- It registers the picture in a database for easier further treatment.
Features - Cameras: web interface
Once pictures are stored on a filesystem folder, and registered in a database, it is easy to retrieve them for use on an interface.
Besides, an additional effort has been done to integrate the camera viewer into the map interface, using the maximum space available,
and letting user interact with the images.
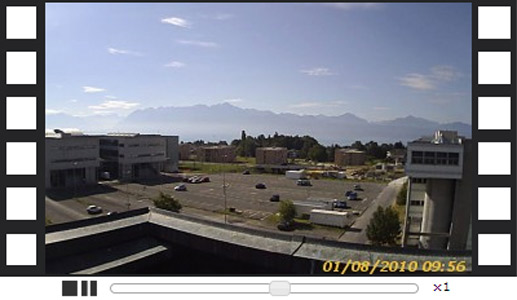
Thanks to
jQuery, still pictures can be animated as a movie.
- An administrative interface allows to manage cameras: a camera must be manually registered and linked to a station before it can send data.
- In map view, sensor type 'camera' is recognized as every other sensor, since stations write a packet for cameras on the main data tables every 15 minutes.
- When a sensor type 'camera' is selected, the AJAX query gets not a graph, but the list of pictures received on the time interval selected.
- With that list, a div is filled with <img/> tags and set to display as a fixed size box whose content fits just one picture at once.
- Some buttons are added as controls to allow users interact with the pictures.
- Thanks to jQuery, when the 'play' button is clicked, the pictures visibility starts to roll from the first to the last one and back. This fakes a movie.
- Every single picture has been registered with prettyPhoto (a jQuery port of lightbox), so that they can be seen at big size.
- A new camera sensor request will reset JS variables and re-fill the HTML container.
Features - Administration: common interfaces
Administrative interfaces are one of the most important part of Climaps application. However, they have been left
to be explained at the end because their implementation is quite trivial, once the correct system and parent classes
have been developed.
Common edition interface shared by all administration pages.
-
MVC paradigm.
-
Controllers get the data from web forms, process it to detect the right work flow, and passes it to models to update databases accordingly.
-
Models check data for coherency and consistency, then update databases accordingly.
-
Views reuse code as much as possible since all the admin interfaces follow the same principles. Some views are rendered with layout (normal interface mode), and others without it (XML-AJAX mode).
-
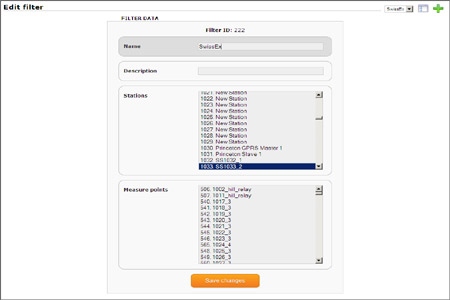
Modules:
- Filters are groups of stations and measure points for an easier user interaction with the site.
- Measure Points are geographical classifications for stations, so that hardware could be easily replaced and moved while keeping geographical information.
- Stations are managed from this interface, only accessible to superadmins.
- Users can be managed for every contact, so that different collaborators share the same data.
- Contacts are groups of users, aka organisations, companies, research groups...
- Sensor Families can be managed from this interface to correct details like 'units' or 'name'; as they are discovered in new data packets, they are registered automatically.
Features - Administration: some examples
Despite a 90% of administrative interfaces share principles and code, there are a few specific examples that may be worthy to talk about.
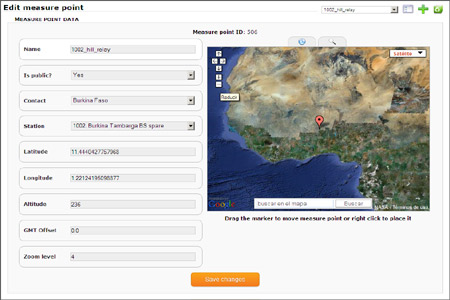
Detail of the measure points edition interface.
-
Stations are protected by 'no deletion' triggers, and they require a new data table to be created.
- When creating a station, triggers are shut down.
- The correspondent register is deleted from Stations table.
- All the related tables are updated thanks to cascade relational definitions.
- A new table is created by invoking a stored function which keeps the table definition inside the data model.
- A script is called to create again triggers.
-
Measure Points need some information to be collected from external sources:
- Latitude, Longitude and Zoom level are taken from Google Maps API.
- Altitude is gathered from an XML external service.
- GMT offset is taken from another XML service.
-
Users can belong to several contacts so that they share their stations and data:
- A common form asks for several users to register.
- If they already exist but belong to other contact, they are registered for the new one and notified.
- If they do not exist, they are created and registered for the selected contact as primary
Features - Statistics and facts
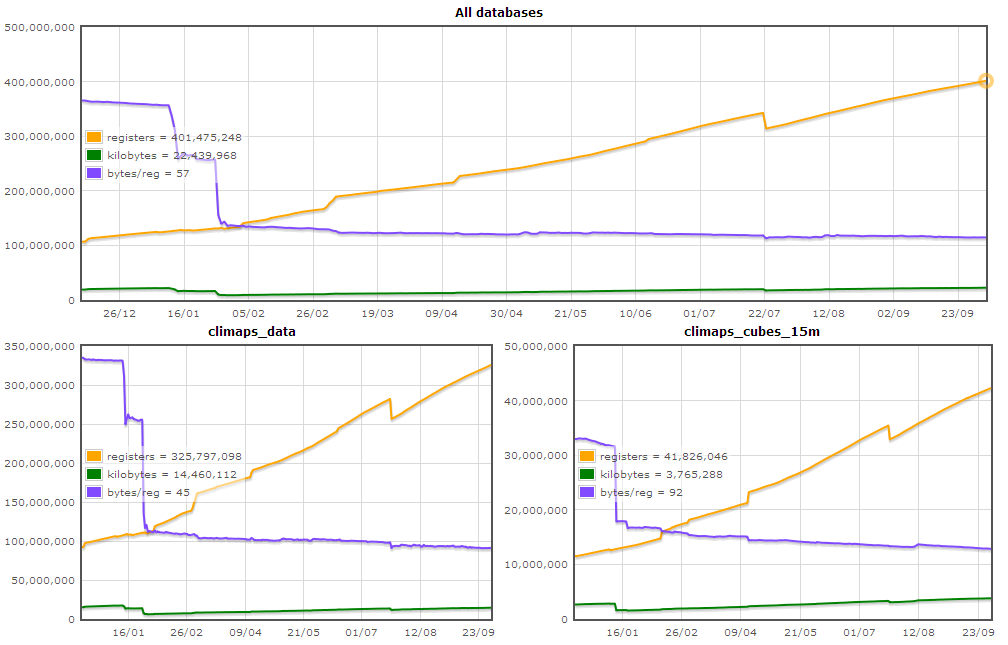
Climaps is a medium size application designed to be scalable to become a big fat boy. As by the date of this report (end 2010),
some numbers ilustrate its impact:
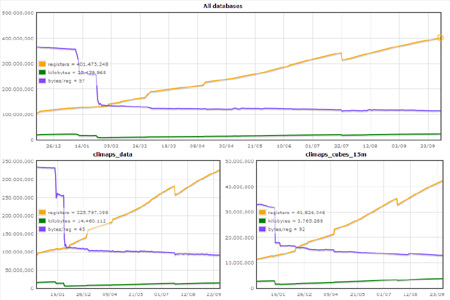
Database use statistics as of 02/10/2010.
- 200 active stations.
- 400 million data registers including data, cubes and logs.
- 20GB disk space used, without considering backups.
- 100 registered users, where about 50 use it daily.
LOC Summary:
-------------------------------------------------------------------------------
Language                     files          blank        comment           code
-------------------------------------------------------------------------------
PHP                            289           5344           9928          21058
Javascript                      25           1159           1826           5941
CSS                             66            273            271           5245
HTML                            26            244            120           2691
SQL                              3            617            387           2579
Bourne Shell                     9            300            156           1310
Perl                             3             99            201            867
Python                           9            221            163            660
-------------------------------------------------------------------------------
SUM:                           430           8257          13052          40351
-------------------------------------------------------------------------------
 Plotter interface implements EJSChart and allows advanced graphs.
 The downloader interface allows on the fly file generation.
 The overview interface provides a quicker way to monitor stations status.
 Database use statistics as of 02/10/2010.